What daily and long-horizon tests reveal about owning the market's largest company
There is an appealing simplicity to owning the largest company in the market. The largest business has already demonstrated scale, attracted capital and established itself as the market's dominant narrative. When another company becomes larger, you sell the old leader and buy the new one.
It sounds like an automatic way to stay attached to the winner.
But market capitalization measures current size, not future return. To see how important that distinction is, we ran two tests:
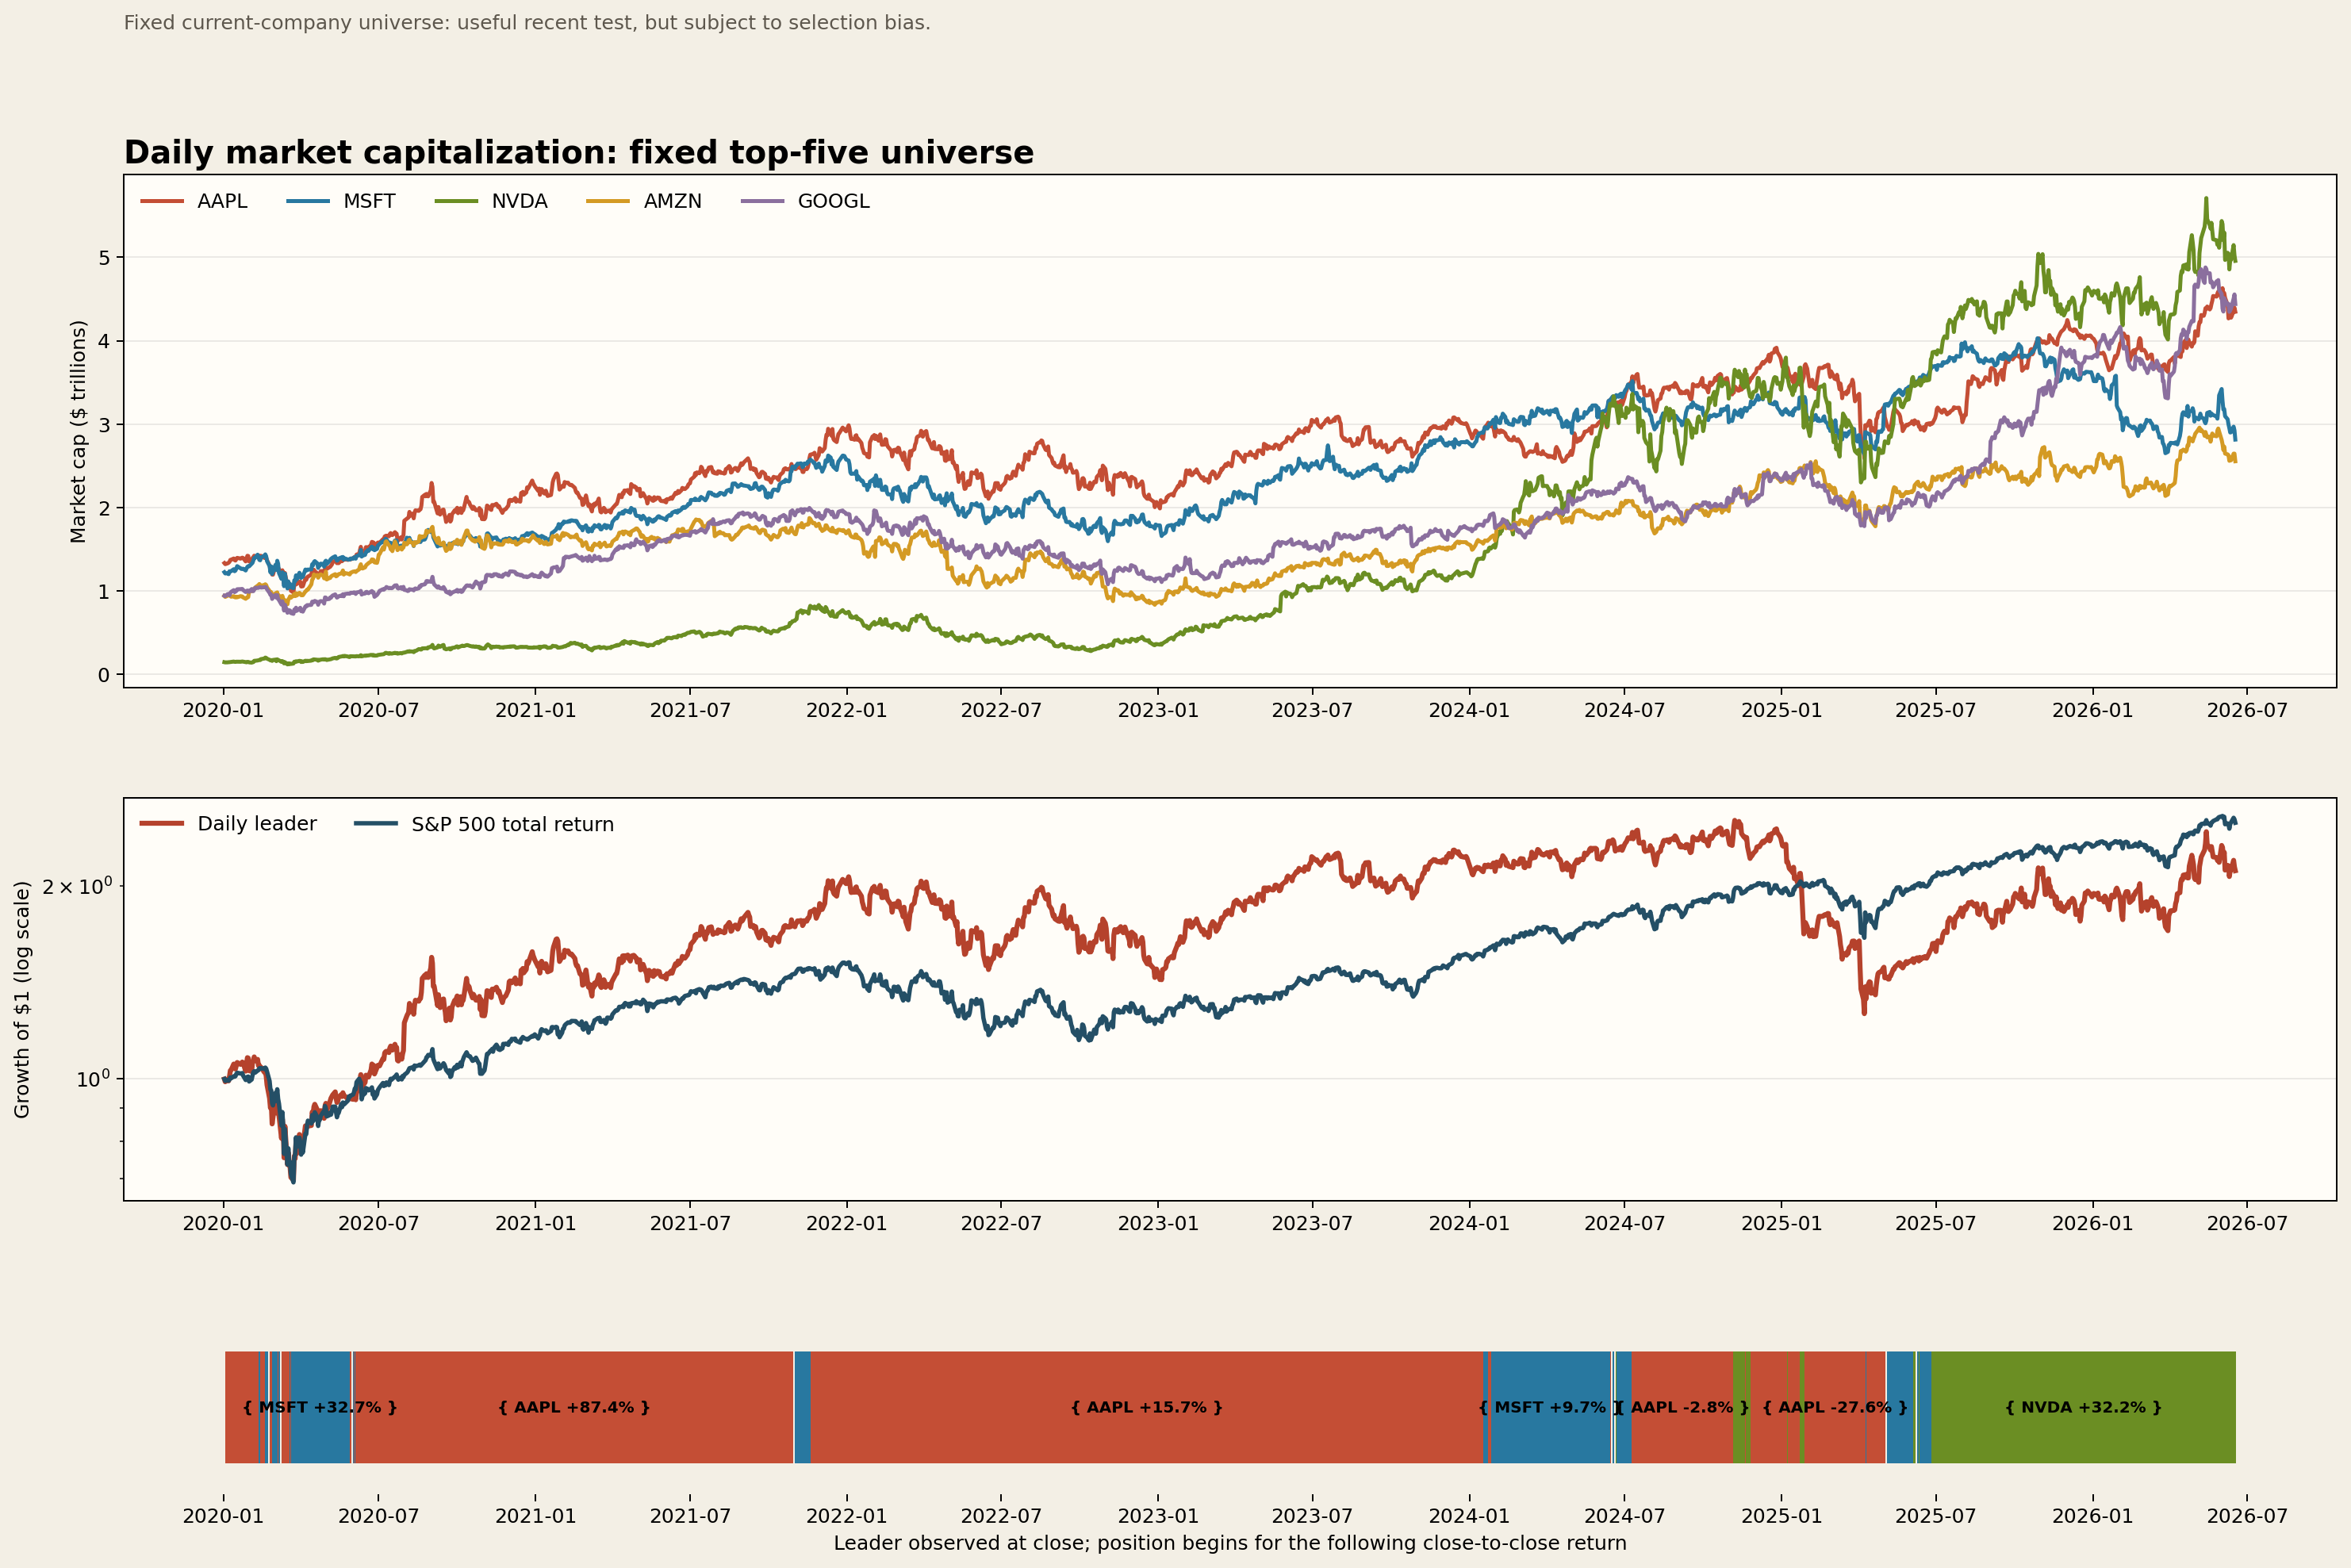
- A recent daily test using Apple, Microsoft, NVIDIA, Amazon, and Alphabet from January 2, 2020 through June 17, 2026.
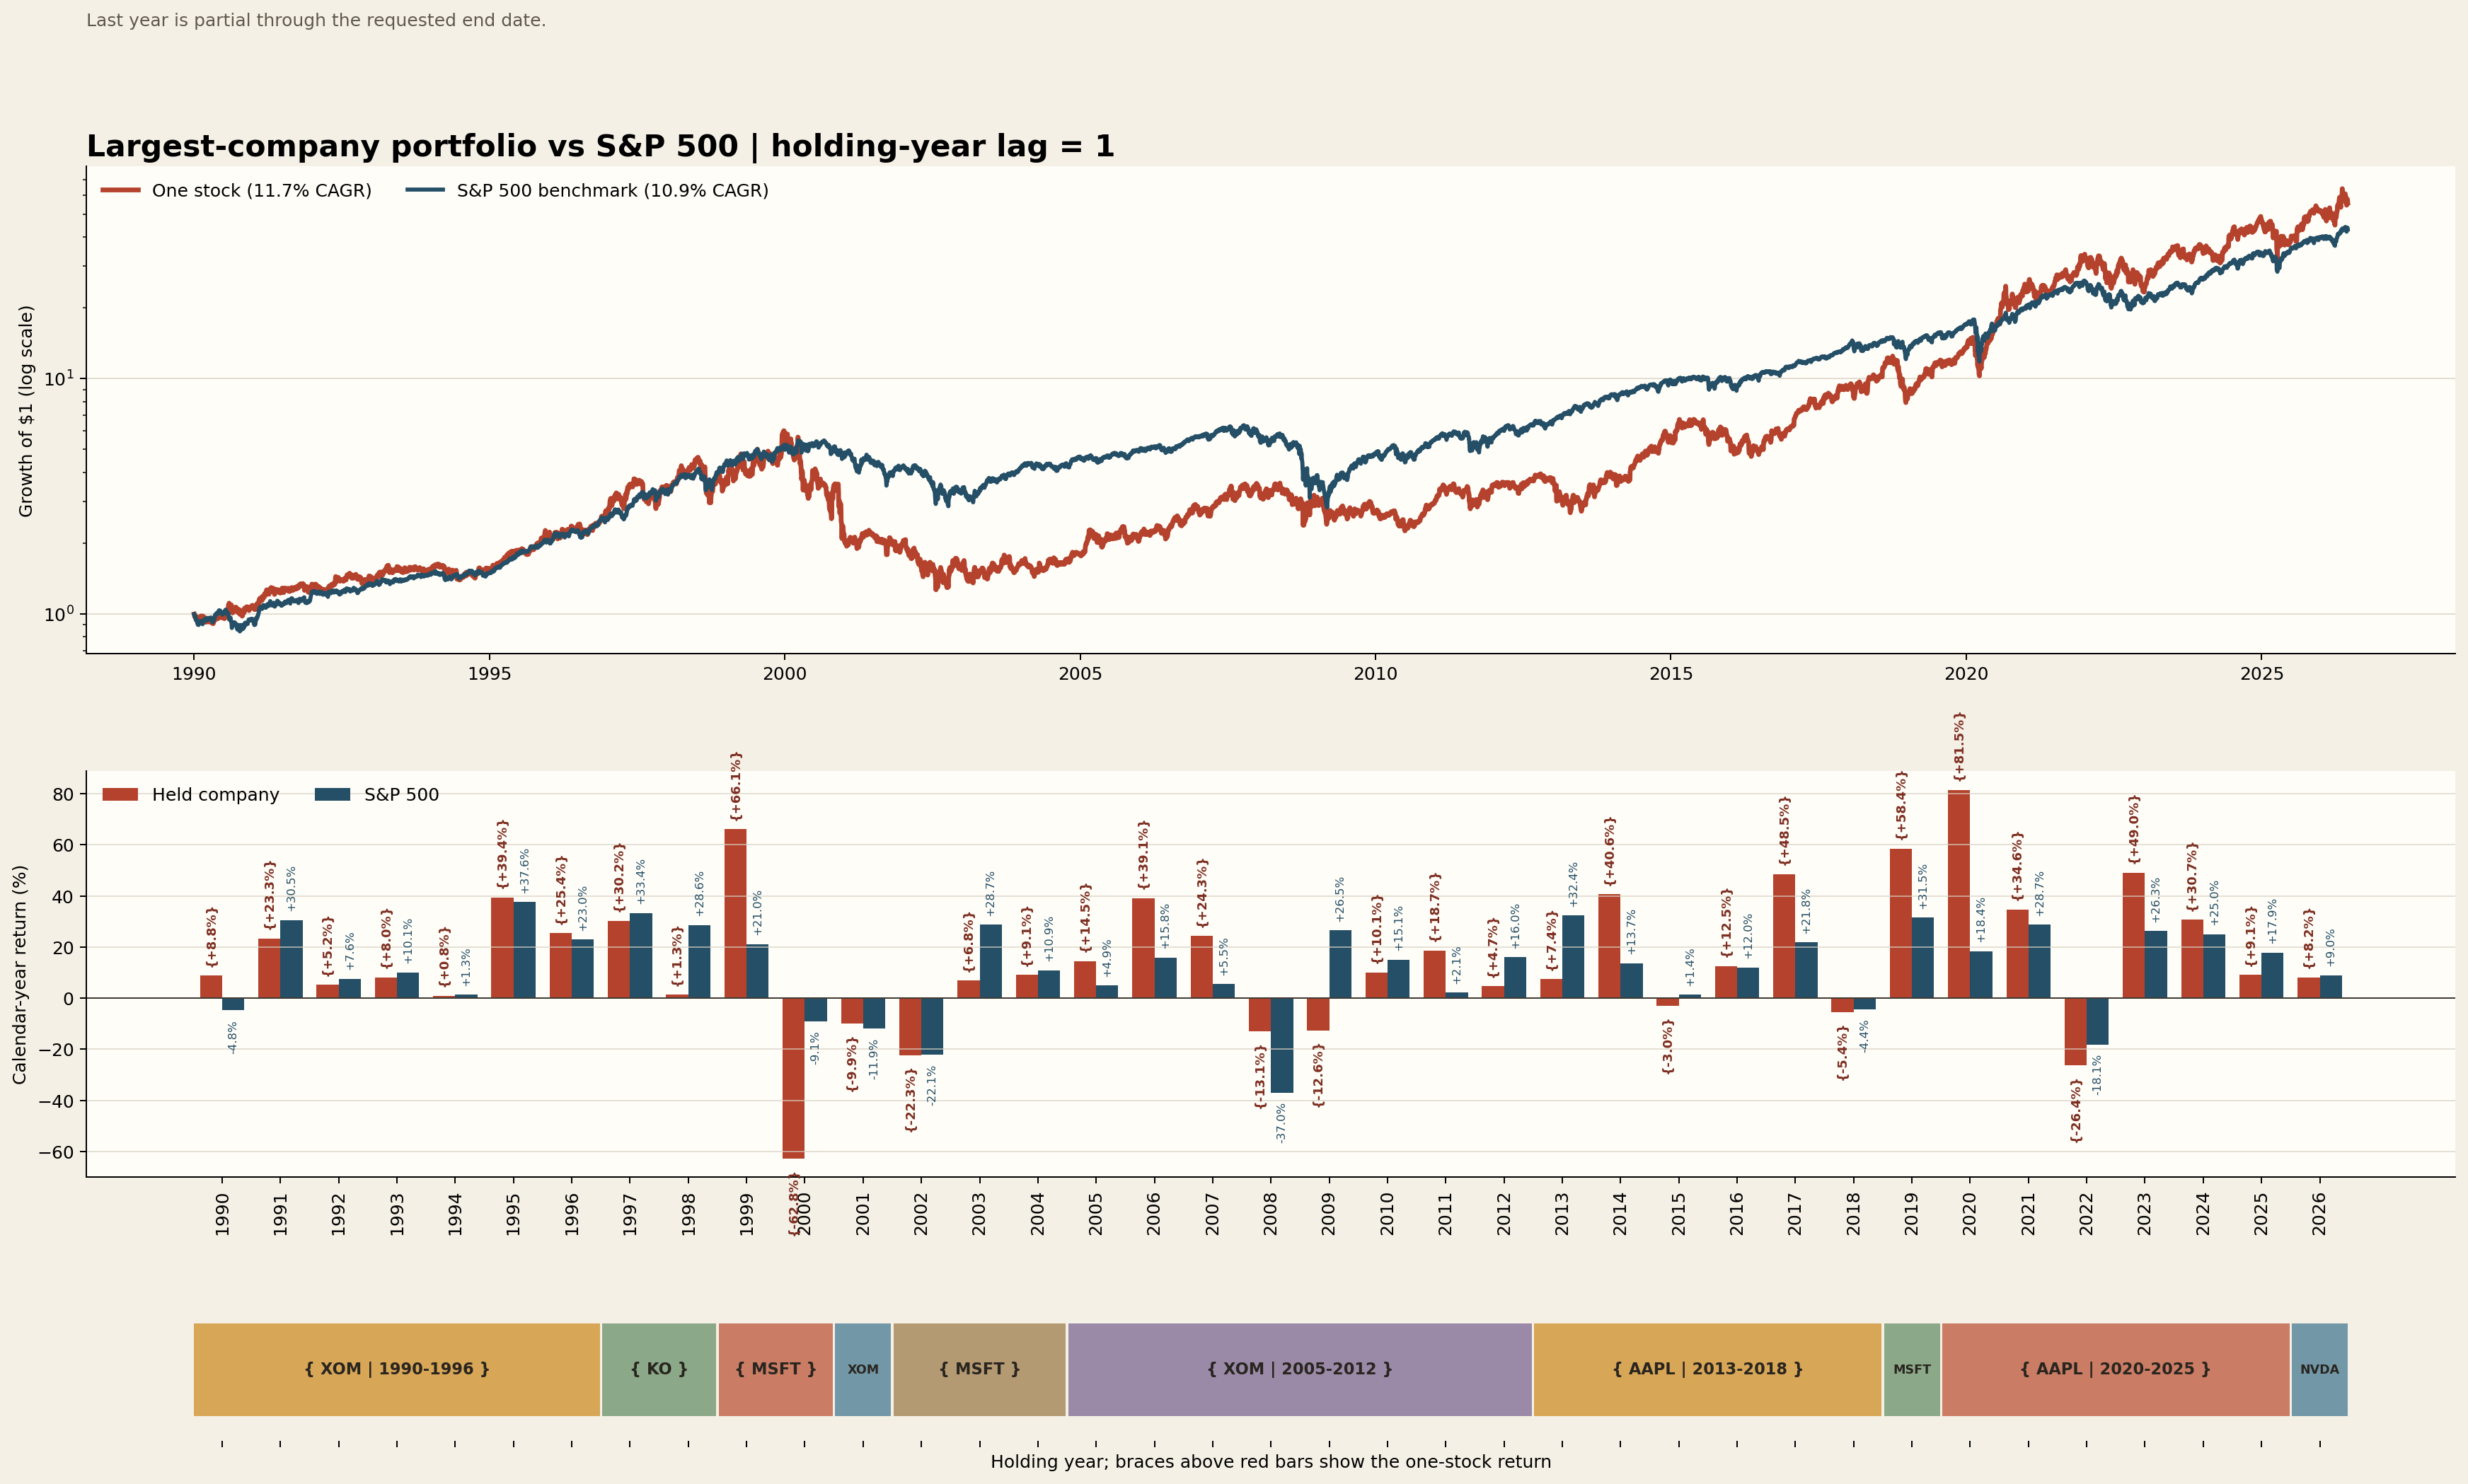
- A longer annual-snapshot test using the largest S&P 500 company from 1990 through June 2026.
The Recent Daily Test
At every market close, we calculated each company's market capitalization:
Market capitalization = closing price x historical shares outstanding
The company with the highest market cap became the signal for the next trading session. This timing matters. A company can only be identified as the closing leader after the close, so its return for that same day was never credited to the strategy.
The benchmark used the following rules:
- Fixed universe: AAPL, MSFT, NVDA, AMZN, and GOOGL
- Signal frequency: daily
- Execution: after the leader was observed at the close
- Returns: dividend- and split-adjusted
- Switching cost: 5 basis points
- Benchmark: S&P 500 Total Return Index
- Starting capital: $10,000
Historical share counts were normalized for stock splits. Isolated vendor observations that temporarily reported inconsistent share units were removed, and the data pipeline rejected unexplained daily market-cap jumps greater than 35%.
The Result
| Metric | Daily Market-Cap Leader | S&P 500 Total Return |
|---|---|---|
| Final value of $10,000 | $20,695 | $25,105 |
| Total return | 106.95% | 151.05% |
| Annualized return | 11.92% | 15.32% |
| Annualized volatility | 33.23% | 20.52% |
| Sharpe ratio | 0.51 | 0.80 |
| Maximum drawdown | -50.26% | -33.79% |
The strategy switched leaders 42 times. Removing transaction costs increased its annualized return to 12.29%, but it still trailed the S&P 500.
The result is not simply a lower return. The market-cap leader also produced substantially higher volatility and a deeper drawdown. Investors accepted more company-specific risk without receiving a higher return over this period.
The Long-Horizon Result: 1990-2026
The daily test is detailed, but it covers only a recent mega-cap technology cycle. We therefore added a longer benchmark using annual S&P 500 market-cap snapshots from the end of 1989 onward.
This test uses a strict one-year lag. The company identified as the year-end leader is held during the following calendar year. For example, the leader observed at the end of 2012 became the 2013 holder. This avoids using a year-end ranking before it was available.
| Metric | Annual Leader Portfolio | S&P 500 Total Return |
|---|---|---|
| Final value of $10,000 | $556,591 | $429,678 |
| Total return | 5,465.91% | 4,196.78% |
| Annualized return | 11.66% | 10.87% |
| Annualized volatility | 28.17% | 18.01% |
| Sharpe ratio | 0.53 | 0.66 |
| Maximum drawdown | -78.87% | -55.25% |
The annual leader portfolio switched companies only nine times. It finished ahead of the index, but the advantage was modest: approximately 0.79 percentage points per year. That additional return came with much higher volatility, a lower Sharpe ratio, and an extraordinary 78.87% maximum drawdown.
In other words, the longer result is not a clean victory. It is a concentrated portfolio that earned slightly more while exposing the investor to substantially greater risk.
The timing trap
If we assign each year-end winner to that same year, the calculated annualized return jumps to 23.07%. That result is invalid because the strategy uses information from the end of the year as though it were known at the beginning.
This is a useful demonstration of lookahead bias. A small timing error changes a plausible 11.66% result into a spectacular but untradeable one.
Apple Shows the Problem Clearly
Apple was the closing market-cap leader on 1,130 trading days, far more often than Microsoft or NVIDIA. It also generated excellent returns during some long leadership periods:
- June 4, 2020 to October 29, 2021: +85.82%
- November 19 2021 to January 16, 2024: +17.65%
However, being the largest company did not protect Apple from losses. Recent Apple leadership periods included:
- July 9, 2024 to November 4, 2024: -2.44%
- January 8, 2025 to January 21, 2025: -8.08%
- January 28, 2025 to April 8, 2025: -24.91%
Apple could fall while remaining number one because the ranking is relative. It did not need to rise; it only needed to remain more valuable than Microsoft, NVIDIA, and the other companies in the test.
That is the core weakness of the signal: largest does not mean rising.
Why the Strategy Struggled
1. Market cap is a backward-looking achievement
A company normally reaches the top after years of strong operating performance and share-price appreciation. The ranking confirms what has already happened. It does not establish that the next dollar of return will be equally strong.
2. Leadership changes can arrive late
The strategy waits until another company becomes larger. By that point, the existing leader may already have suffered a substantial decline. The rule is reactive rather than predictive.
3. Close races create whipsaws
When Apple, Microsoft and NVIDIA have similar market capitalizations, small daily price changes can repeatedly change the ranking. That creates short holding periods, transaction costs and sensitivity to execution timing.
4. One stock is still one stock
Market leadership does not remove company-specific risk. Product cycles, regulation, valuation compression and earnings disappointments remain concentrated in a single position. The S&P 500 spreads those risks across hundreds of companies.
What the Test Does Not Prove
These are controlled experiments, not definitive tests across all public companies.
The five companies were selected using today's knowledge, which introduces survivorship and selection bias. A fully point-in-time study would need a historical universe containing every eligible company, daily prices, historical shares outstanding, multiple share classes and precise publication dates for every share-count update.
The daily test covers a period dominated by mega-cap technology. The long test extends the history, but its leader source contains only annual year-end snapshots beginning in 1989. It cannot capture leadership changes occurring within a year.
The Takeaway
Following market-cap leadership is useful as a way to understand where capital and investor attention are concentrating. The evidence does not support treating it as an obviously superior standalone portfolio strategy.
From January 2020 through June 2026, the daily leader portfolio returned 11.92% annually, compared with 15.32% for the S&P 500 Total Return Index. It also experienced a 50.26% maximum drawdown.
Over the longer 1990-2026 annual test, the leader portfolio returned 11.66% annually, compared with 10.87% for the index. However, its maximum drawdown reached 78.87%, and its risk-adjusted return was lower.
The market's largest company can be an exceptional business. It can also be an expensive, declining stock that remains number one only because its competitors are still smaller.
Size tells us who has already won the race to the top. It does not tell us who will run fastest from here.
Data sources: Yahoo Finance historical prices and shares outstanding; FinHacker annual S&P 500 market-cap snapshots compiled from EDGAR, YCharts, Bloomberg and Yahoo Finance. The daily test uses a close-confirmed, next-session signal and a 5 basis-point switching cost. The annual test uses the previous year-end leader. This article is for research and educational purposes and is not investment advice.

Discussion (0)